


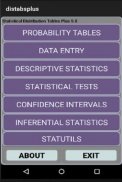


Statistical Tables Plus 5.3
Beschreibung von Statistical Tables Plus 5.3
Statistical Tables Plus Version 5.2
Value packed combination of Probability
Distribution Tables, plus commonly used
statistical inference tests.
Updated UI. Inference Test Formulas
added for one and two population means.
Convenient, Accurate, Easy to Read
electronic Probability Distribution Tables.
Commonly used statistical inference tests.
Confidence Interval calculation.
Normal, Binomial, Poisson, T, F and Chi-Square
Distributions. Also, invNorm and
invT calculations.
Data entry for 10 variables.
Descriptive Statistics. (Added Percentiles,
Skewness and Kurtosis).
Statistical Tests Including t-test, ANOVA,
MannWhitneyU Test, Chi-Square Test,
Simple Linear Regression.
Contains calculators for Confidence
Intervals (Sigma Known, Sigma Unknown,
Proportion), Permutations and Combinations.
Great for Intro Probability Statistics
courses, or if you just need these tables!
For both Phone and 10' tablets.
These tables give you the probabilities
associated with your test statistics and
parameters.
To use these tables, just select the
distribution you want, and put in the
test statistic and parameters, and the
APP tells you the related probability.
*************************************
1) For the Normal Distribution:
Enter your Z Score, and you get
the left, right tails and the range.
2) For the Binomial Distribution:
Enter n - number of trials,
p - probability of success,
x - number of successes
and you get the probability of
x, or the cumulative probability
for x.
3) For the Poisson Distribution:
Enter the mean, and number of
occurences, and you will get
the Probability of the number
of occurences, and the cumulative
probability.
4) For the t Distribution:
Enter t and the Degrees of Freedom
and you will get the probability
of the left and right tails, and
the two tailed probability.
5) For the f Distribution:
Enter the f statistic, and the
Degrees of Freedom for the numerator
and denominator. You will get the
probability for the right tail
(alpha for the ANOVA test).
6) For the Chi-Square Distribution:
Enter Chi-Square and the Degrees of Freedom
and you will get the probability
of the right tail.
7) Inverse Normal.
Enter the probability of the
Normal Distribution left tail,
and you get the Z statistic.
8) Inverse t
Enter the probability of the
t distribution left tail, along with
the degrees of freedom, and you will
get the t statistic.
Confidence Intervals:
Sigma Known. Uses the standard
CI formula (Using Z) to determine the range with
CI% chance of containing the true mean
of the population.
Sigma unKnown. Uses the standard
CI formula (Using t) to determine the range with
CI% chance of containing the true mean
of the population.
CI for a proportion. Uses the standard
CI formula (Using p,n,Z) to determine the range with
CI% chance of containing the true mean
of the population.
Statistical Utilities:
Permutations and Combinations give number
of ways to select n Items out of N Items.
In Permutations Order of selected Items matters,
in Combinations it does not. Sampling is
without replacement.
Sample size n, is number needed for CI with
following parameters:
alpha - CI between 0 and 1.0
sigma - Known standard deviation.
E - desired error.
Formula is: n = (Z^2 * s^2) / E^2
Z is Z score for (1-alpha)/2
Includes 5 common statistical tests,
and Descriptive Statistics.
Help for each test is included in
the APP.
Inferential Statistics Formulas:
Difference between 2 Population Means.
Hypothesis Test Mean.
Proportions.
Free!. Please visit this APP in
the Google Play store to Rate and
enter comments. This will help us
improve the APP over time.
Due care has been taken for accurate results.
This APP is for educational use.
However, no warrenty against any damages due to
use is included or implied.
Statistische Tabellen Plus Version 5.2
Wertvolle Kombination von Wahrscheinlichkeit
Verteilungstabellen sowie häufig verwendete
statistische Inferenztests.
Aktualisierte Benutzeroberfläche. Inferenztestformeln
hinzugefügt für ein und zwei Bevölkerungsmittel.
Bequem, genau, einfach zu lesen
elektronische Wahrscheinlichkeitsverteilungstabellen.
Häufig verwendete statistische Inferenztests.
Konfidenzintervallberechnung.
Normal, Binomial, Poisson, T, F und Chi-Quadrat
Verteilungen. Auch invNorm und
InvT-Berechnungen.
Dateneingabe für 10 Variablen.
Beschreibende Statistik. (Perzentile hinzugefügt,
Schiefe und Kurtosis).
Statistische Tests einschließlich t-Test, ANOVA,
MannWhitneyU-Test, Chi-Quadrat-Test,
Einfache lineare Regression.
Enthält Taschenrechner für das Vertrauen
Intervalle (Sigma bekannt, Sigma unbekannt,
Anteil), Permutationen und Kombinationen.
Hervorragend geeignet für Intro-Wahrscheinlichkeitsstatistiken
Kurse, oder wenn Sie nur diese Tische brauchen!
Für Telefon- und 10-Zoll-Tablets.
Diese Tabellen geben Ihnen die Wahrscheinlichkeiten
im Zusammenhang mit Ihrer Teststatistik und
Parameter.
Um diese Tabellen zu verwenden, wählen Sie einfach die
Verteilung, die Sie wollen, und setzen Sie in die
Teststatistik und -parameter sowie die
APP sagt Ihnen die damit verbundene Wahrscheinlichkeit.
****************************************
1) Für die Normalverteilung:
Geben Sie Ihren Z-Score ein und Sie erhalten
die linken, rechten Schwänze und die Reichweite.
2) Für die Binomialverteilung:
Geben Sie n - Anzahl der Versuche ein,
p - Erfolgswahrscheinlichkeit,
x - Anzahl der Erfolge
und Sie erhalten die Wahrscheinlichkeit von
x oder die kumulative Wahrscheinlichkeit
für x.
3) Für die Poisson-Verteilung:
Geben Sie den Mittelwert und die Anzahl von ein
Vorkommen, und Sie werden bekommen
die Wahrscheinlichkeit der Zahl
von Vorkommen und die kumulative
Wahrscheinlichkeit.
4) Für die t-Verteilung:
Geben Sie t und die Freiheitsgrade ein
und Sie werden die Wahrscheinlichkeit bekommen
der linken und rechten Schwänze und
die zweiseitige Wahrscheinlichkeit.
5) Für die f-Verteilung:
Geben Sie die f-Statistik und die
Freiheitsgrade für den Zähler
und Nenner. Sie werden die bekommen
Wahrscheinlichkeit für den rechten Schwanz
(Alpha für den ANOVA-Test).
6) Für die Chi-Quadrat-Verteilung:
Betreten Sie den Chi-Platz und die Freiheitsgrade
und Sie werden die Wahrscheinlichkeit bekommen
des rechten Schwanzes.
7) Inverse Normal.
Geben Sie die Wahrscheinlichkeit der
Normalverteilung linker Schwanz,
und Sie erhalten die Z-Statistik.
8) Invers t
Geben Sie die Wahrscheinlichkeit der
t Verteilung linker Schwanz, zusammen mit
die Freiheitsgrade, und du wirst
Holen Sie sich die t-Statistik.
Vertrauensintervalle:
Sigma bekannt. Verwendet den Standard
CI-Formel (mit Z) zur Bestimmung des Bereichs mit
CI% Chance, den wahren Mittelwert zu enthalten
der Bevölkerung.
Sigma unbekannt. Verwendet den Standard
CI-Formel (mit t) zur Bestimmung des Bereichs mit
CI% Chance, den wahren Mittelwert zu enthalten
der Bevölkerung.
CI für einen Anteil. Verwendet den Standard
CI-Formel (unter Verwendung von p, n, Z) zur Bestimmung des Bereichs mit
CI% Chance, den wahren Mittelwert zu enthalten
der Bevölkerung.
Statistische Dienstprogramme:
Permutationen und Kombinationen geben die Nummer an
von Möglichkeiten, n Elemente aus N Elementen auszuwählen.
In der Permutationsreihenfolge der ausgewählten Elemente ist Folgendes wichtig:
in Kombinationen nicht. Probenahme ist
ohne Ersatz.
Die Stichprobengröße n ist die Nummer, die für CI mit benötigt wird
folgende Parameter:
Alpha - CI zwischen 0 und 1,0
Sigma - Bekannte Standardabweichung.
E - gewünschter Fehler.
Die Formel lautet: n = (Z ^ 2 * s ^ 2) / E ^ 2
Z ist die Z-Punktzahl für (1-Alpha) / 2
Beinhaltet 5 gängige statistische Tests,
und beschreibende Statistik.
Hilfe für jeden Test ist in enthalten
die App.
Inferenzstatistikformeln:
Unterschied zwischen 2 Bevölkerungsmitteln.
Hypothesentest Mittelwert.
Proportionen.
Kostenlos!. Bitte besuchen Sie diese APP in
den Google Play Store zu bewerten und
Kommentare eingeben. Das wird uns helfen
verbessern Sie die APP im Laufe der Zeit.
Es wurde sorgfältig auf genaue Ergebnisse geachtet.
Diese APP ist für Bildungszwecke.
Es besteht jedoch keine Garantie gegen Schäden aufgrund von
Verwendung ist enthalten oder impliziert.
Statistical Tables Plus 5.3 – APK Informationen
APK Version: 5.7Paket: com.marcusacademy.stattabsplusNeueste Version von Statistical Tables Plus 5.3
Weitere Versionen


Apps in derselben Kategorie


Das könnte dir auch gefallen...


